Trajectory Explorer
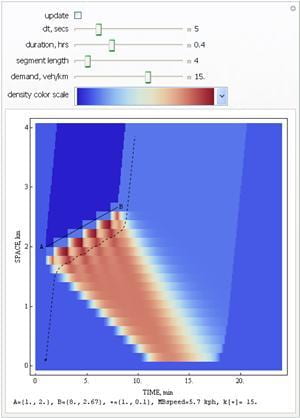
This program allows you to analyze vehicle trajectory data visually and interactively, directly from a bitmap image.

Draw a line on the image to compute wave speed, number of vehicles crossing the line, etc. Draw an area to calculate flow, speed and density using Edie’s generalized definitions, and see the results in flow-density diagram.
Getting Started
Download, unzip and run the TrajectoryExplorer2.0.exe file. When you run the program open the “Open_all.txt” file in the directory containing the images you want to analyze. This will open all the images in that directory, typically one image per lane and per direction. You can also open individual bitmap images, but remember to imput the length and duration of the measurements.
Each control in the application has a tooltip. This means that if you place the mouse on top of a control you will see a textbox explaining what it does.
To exit the program go File->Exit and there will be a new file named “Edie.txt” in the directory you chose previously. This file contains a log of each measurement, including the lane number, speed, density, flow and location.
Data Sets
Please see the Associated File(s) section to download these data sets. For more info on the original datasets click the reference link above.
- NGSIM bitmaps for US 101(reference)
- NGSIM bitmaps for I-80 (reference)
- NGSIM bitmaps for Peachtree St. (reference)
- NGSIM bitmaps for Lankershim Blvd. (reference)
- Ben Coifman’s shockwaves (reference)
- FHWA’s I-395 bitmaps
Associated Files
NetLogo simulations
More models: Percolation, ECA 184
MATHEMATICA NOTEBOOK
On-off Ramps as a Continuum
Moving Bottlenecks
Tools
Speed Calculator
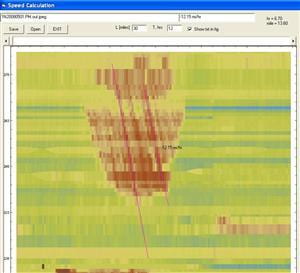
This program lets you load a time-space map and compute the speed of lines you draw over this map. Particularly useful for calculating the wave speed of traffic maps obtained with loop detectors.
This program doesn’t require installation. Just save it to a directory of your choice and double-click it. Then:
- open the picture you want to analyze, (BMP or JPG)
- click in the origin,
- input the height and width of the picture in units of miles and hours, respectively,
- and start drawing lines !
When you exit the program, there will be a new file named “AAA_scal.txt” (where AAA is the picture filename) in the directory of the picture which contains all the speeds you calculated and the initial ending points of the corresponding lines.
** You may need to download VB6 runtime files from Microsoft’s website.